In today’s competitive manufacturing environment, what you measure directly influences what you can improve. Plant managers need real-time visibility into production, machines, quality, energy, and operational efficiency to make faster and smarter decisions.
Instead of relying only on monthly reports, monitoring the right manufacturing KPIs helps identify problems early, reduce losses, and continuously improve plant performance.
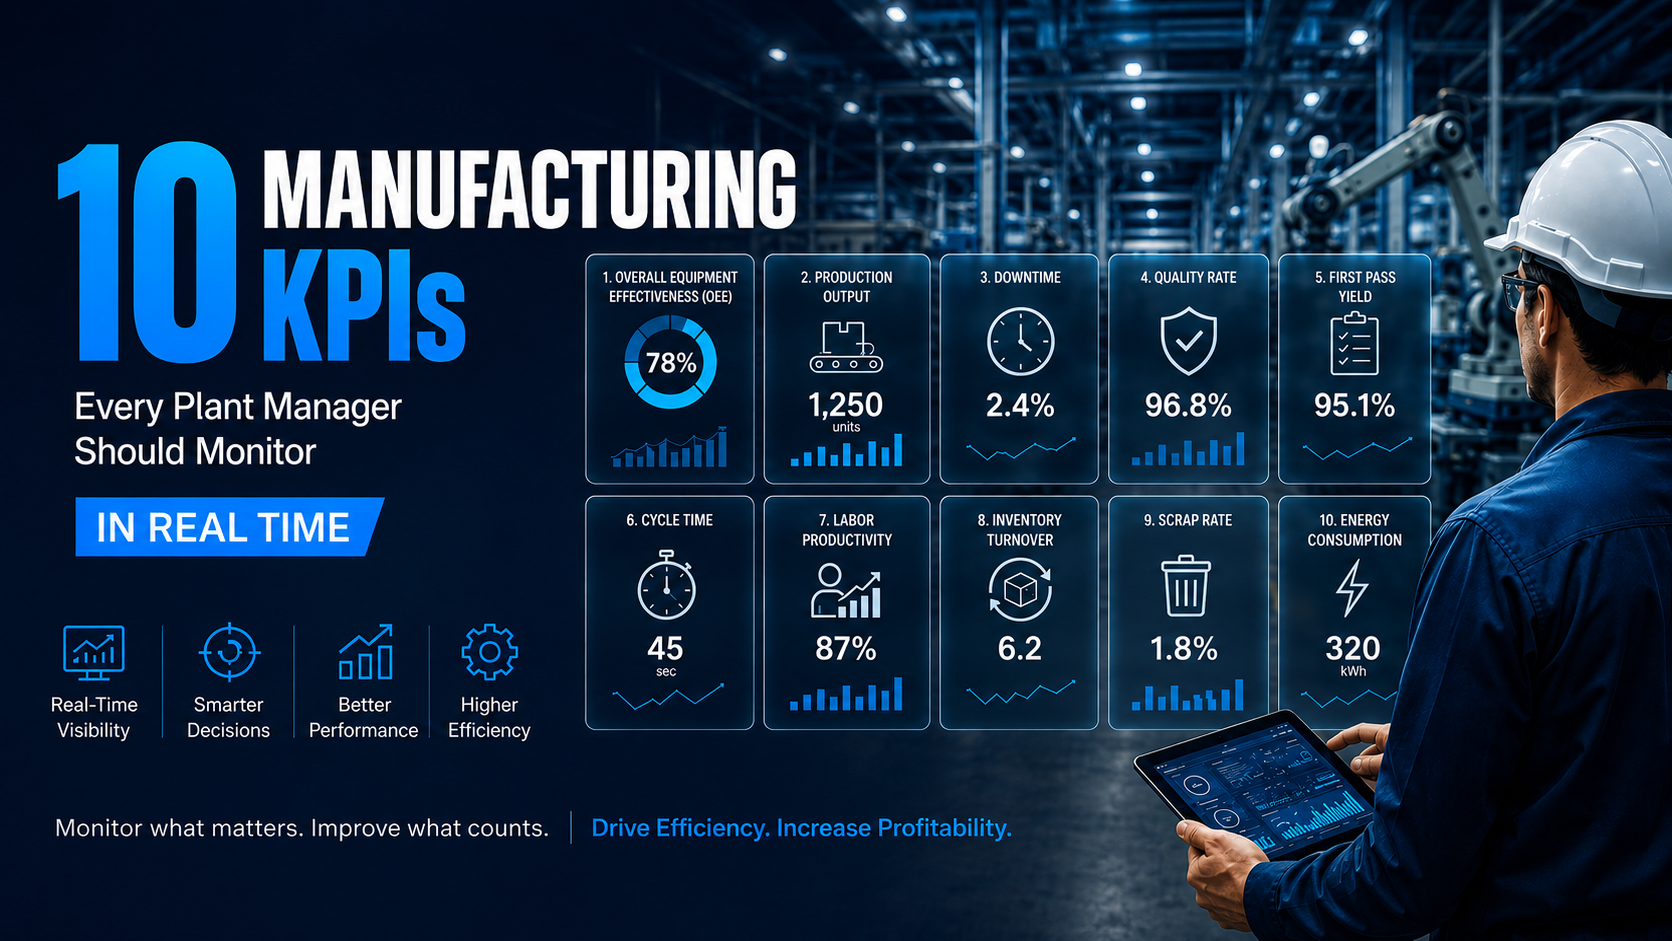
Here are 10 essential KPIs every plant manager should monitor:
1. Overall Equipment Effectiveness (OEE)
OEE measures Availability, Performance, and Quality to show how effectively machines are being utilized. A declining OEE can highlight equipment downtime, slow production, or quality losses.
2. Production Output
Production output shows how many units are produced within a specific period. Comparing actual output with production targets helps managers identify gaps and take corrective action before the shift ends.
3. Downtime
Downtime measures how long machines or production lines are unavailable. Tracking downtime by machine, shift, and cause helps identify recurring breakdowns and major sources of production loss.
4. Quality Rate
Quality rate shows the percentage of products that meet required standards. Monitoring quality in real time helps detect process problems early and reduce defective products.
5. First Pass Yield (FPY)
FPY measures the percentage of products that pass inspection without rework or repair. A higher FPY means better process stability, lower rework costs, and more efficient production.
6. Cycle Time
Cycle time measures how long it takes to produce one unit or complete one production cycle. Comparing actual cycle time with the ideal cycle time helps identify slow machines and production bottlenecks.
7. Labor Productivity
Labor productivity compares production output with the labor hours required. It helps managers understand workforce efficiency and identify opportunities to improve processes and reduce unnecessary waiting time.
8. Inventory Turnover
Inventory turnover indicates how efficiently materials and inventory are being used. Monitoring it helps maintain the right stock levels while reducing excess inventory and the risk of material shortages.
9. Scrap Rate
Scrap rate measures the percentage of production that becomes unusable due to defects. Reducing scrap can significantly lower raw material, labor, energy, and production costs.
10. Energy Consumption
Energy consumption measures electricity and other utilities used by the plant. Monitoring energy consumption per unit produced helps identify inefficient equipment, excessive consumption, and opportunities for energy savings.
Why Real-Time KPI Monitoring Matters
Traditional reports often show what happened yesterday. Real-time monitoring shows what is happening now.
With real-time KPI monitoring, plant managers can:
- Identify production losses immediately
- Reduce unplanned downtime
- Detect quality problems faster
- Improve machine utilization
- Reduce scrap and waste
- Control energy consumption
- Compare machine and line performance
- Make faster, data-driven decisions
Turn Manufacturing Data into Action with Syncross
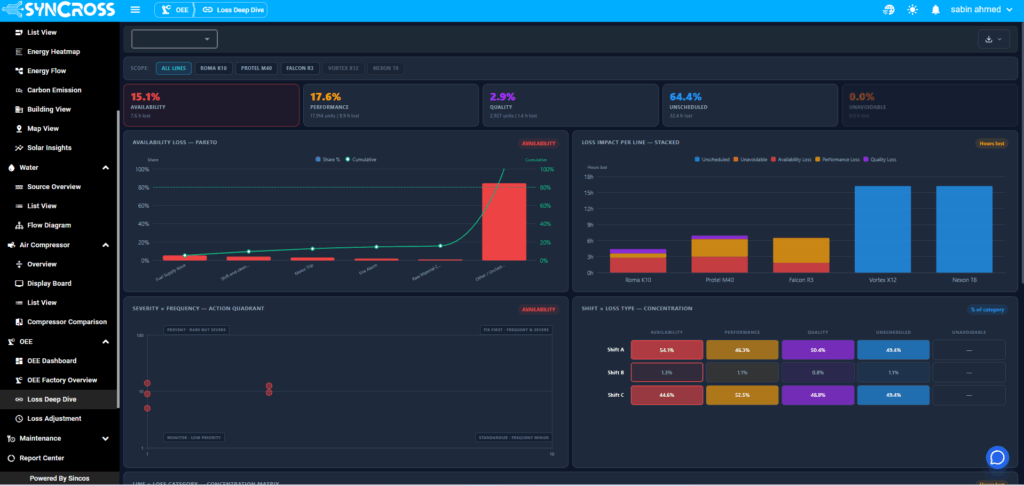
Syncross is an IIoT-based platform that brings critical manufacturing data into a centralized, real-time dashboard. It helps plant managers monitor OEE, production, downtime, quality, energy, and other operational KPIs from machines and production systems.
Instead of waiting for reports to identify problems, managers can see performance trends, detect abnormalities, and take action when it matters most.